NEW: Updated NCCN MM Guidelines Strengthen Recommendation for Baseline Clonotype ID at Diagnosis.
Covered by Medicare and FDA-cleared, clonoSEQ supports baseline ID assessment to enable subsequent next generation sequencing (NGS)-based MRD tracking. For more info about incorporating clonoSEQ into your clinical practice for MM patients, click here.
The clonoSEQ report
Disease burden at your fingertips
Measurable residual disease (MRD) monitoring with clonoSEQ begins with two steps.
clonoSEQ MRD testing can be ordered throughout the treatment continuum in lymphoid cancer care. A baseline test, the Clonality (ID) Test, is required to enable subsequent MRD tracking.
Looking for clonoSEQ results? Visit our Diagnostic Portal
Clonality (ID) Test
- Identifies dominant sequences from the patient’s cancer cells so they can be monitored over time
- Uses a high disease-burden bone marrow/blood sample from a specimen obtained at diagnosis or relapse
- For CLL patients, immunoglobulin heavy chain variable region (IGHV) mutation status is included with the Clonality (ID) Test
Tap numbers on the report for more information.


Clonality (ID) Report
Clonality (ID) Report
Page 1 of the report shows that a dominant DNA sequence or sequences were identified from the submitted sample.
Clonality (ID) Report
A more detailed description of the results for this sample can be found in the “Results Summary” section.
Clonality (ID) Report
A summary of the criteria used to determine which DNA sequences are dominant and thus can be followed as markers of malignancy is provided at the bottom of the page for reference.
Clonality (ID) Report
Clonality (ID) Report
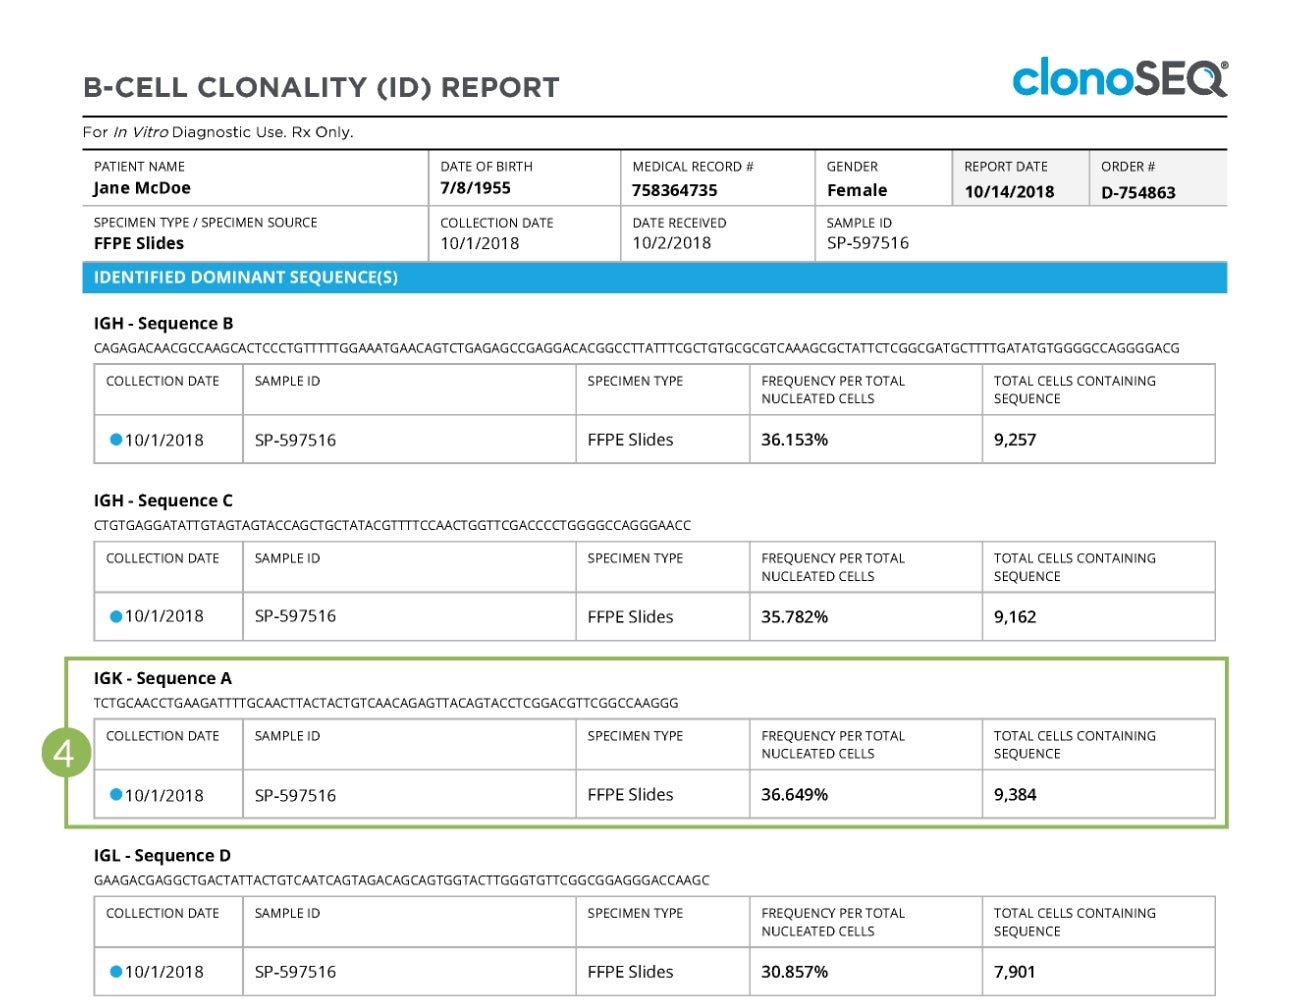
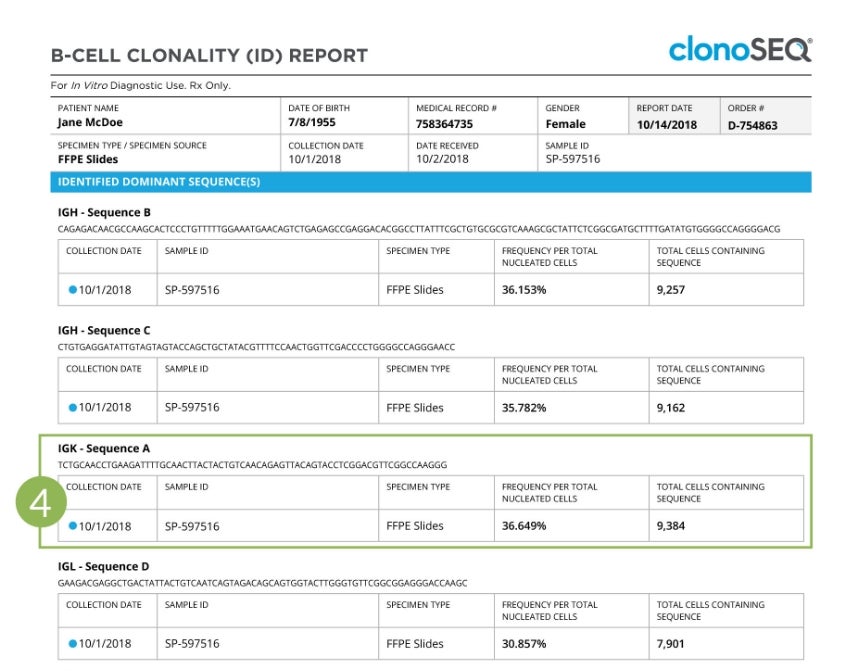
Subsequent pages of the report show detailed information relating to the sample, including the actual rearranged DNA nucleotide sequence or sequences identified, the sample collection date, the receptor locus in which each dominant sequence was found, the specimen type analyzed, the frequency of the dominant sequence as a fraction of the total nucleated cells assessed, and the total number of cells carrying the rearranged DNA sequence.
Clonality (ID) Report
Clonality (ID) Report
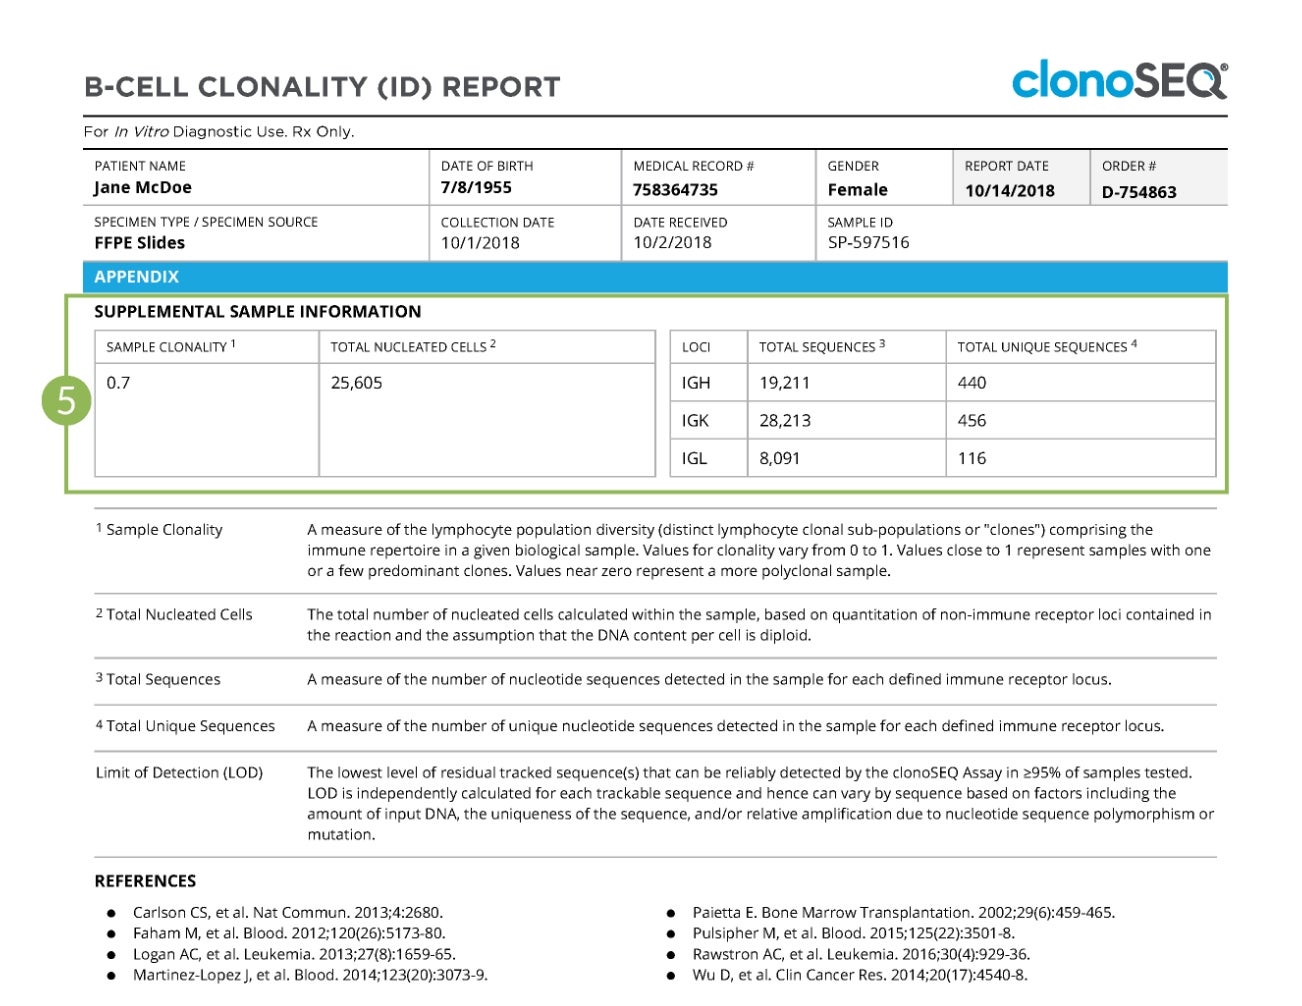
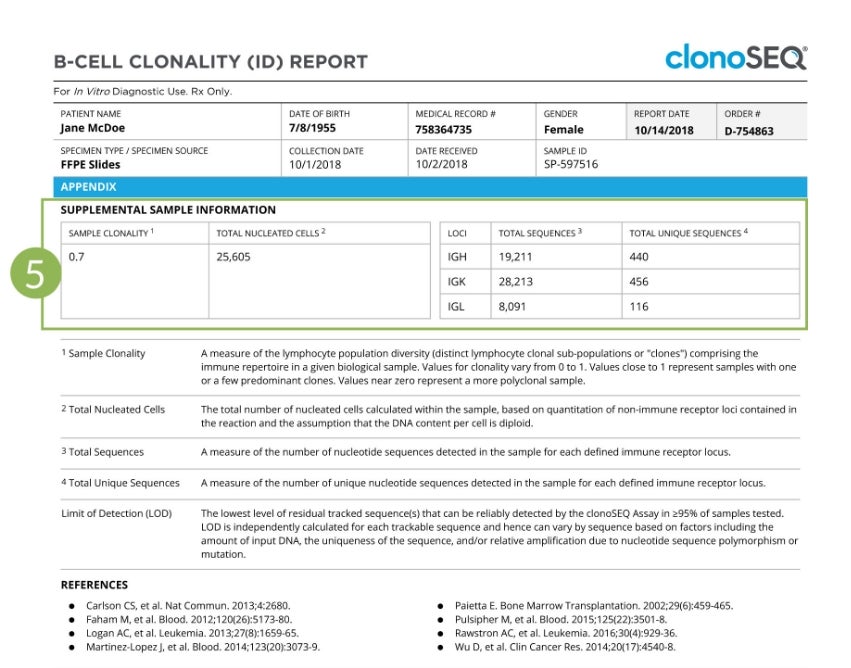
The final page of the report provides more details on the immune repertoire of the analyzed sample, including the sample clonality, the number of sequences assessed for each locus, and the number of unique sequences assessed.
IGHV mutation status results
IGHV mutation status results
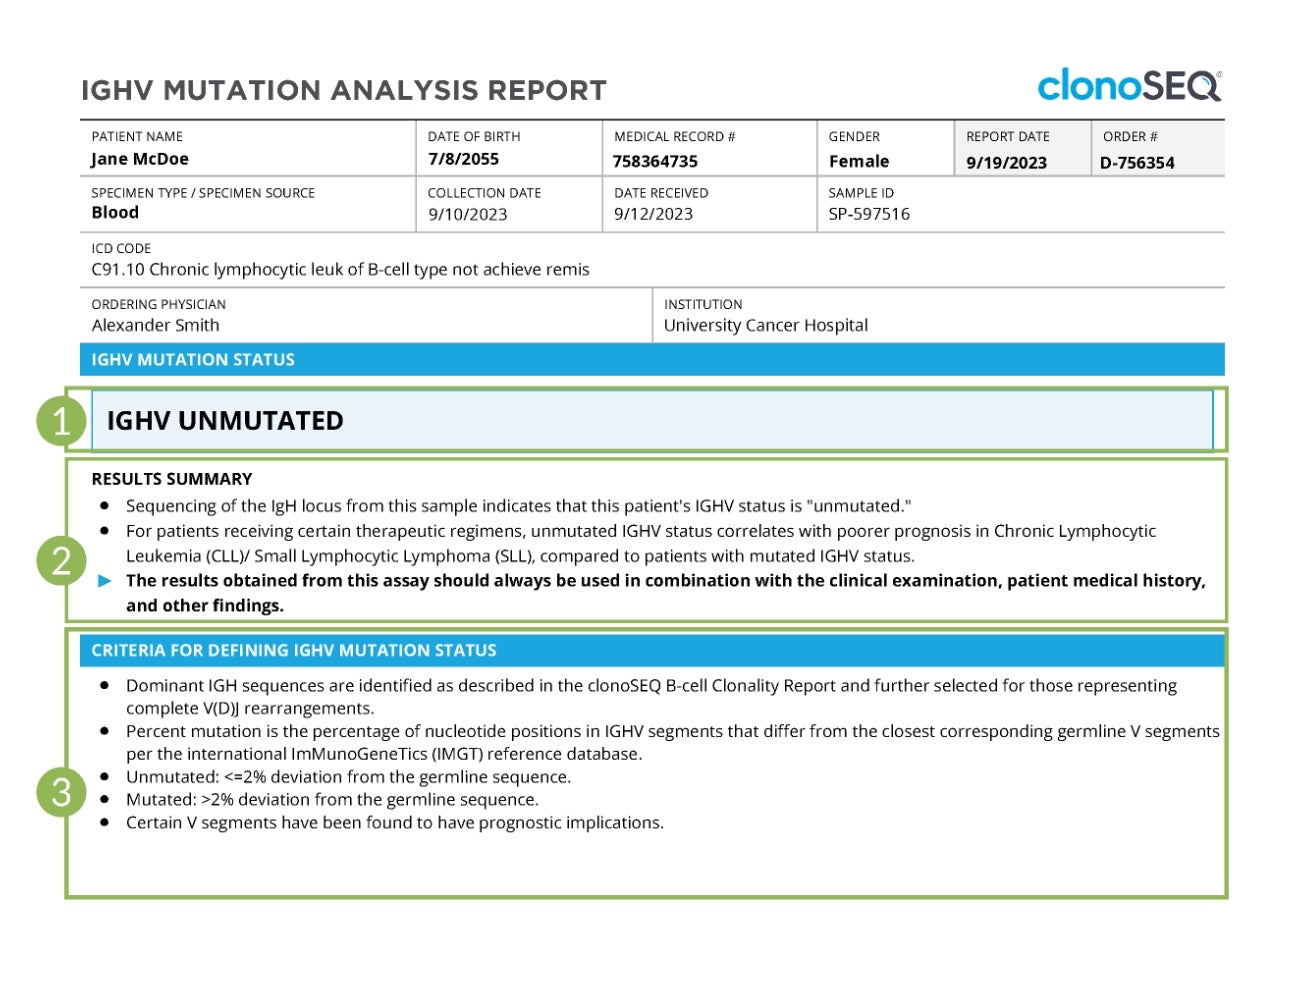
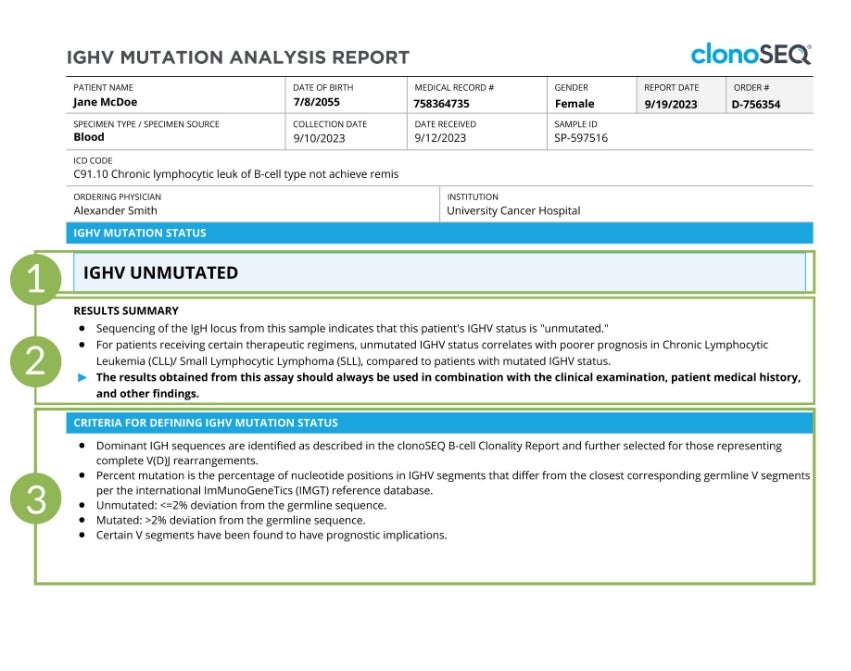
The first page of the IGHV report shows if IGHV is mutated or unmutated.
IGHV mutation status results
A more detailed description of the results for this sample can be found in the “Results Summary” section.
IGHV mutation status results
A summary of the criteria used to determine which immunoglobulin heavy chain (IgH) sequences are dominant is provided at the bottom of the page for reference.
Tracking (MRD) Test
- Visually monitors dominant trackable DNA sequences identified by the Clonality (ID) Test and detects any newly emerging sequences
- Detects changes in disease burden over time
- Supports routine MRD monitoring throughout treatment and monitoring for potential relapse in remission
Tap numbers on the report for more information.
Tracking (MRD) Report: MM, CLL, ALL, and MCL
Tracking (MRD) Report: MM, CLL, ALL, and MCL
In this sample, residual disease was detected by clonoSEQ. This is indicated by the “plus” sign as well as the language stating “Residual Sequences Detected” in the blue box on page 1 of the report.
Tracking (MRD) Report: MM, CLL, ALL, and MCL
Further down the page, the Results Summary states the actual number of sequences observed by the assay and the total number of nucleated cells assessed in the sample.
Tracking (MRD) Report: MM, CLL, ALL, and MCL
In the bottom third of the page, a chart provides a longitudinal view of the sample-level MRD result for the current sample as well as for past samples sent for clonoSEQ testing for this patient.
Tracking (MRD) Report: MM, CLL, ALL, and MCL
Tracking (MRD) Report: MM, CLL, ALL, and MCL
Subsequent pages of the report show detailed information relating to the current and previous samples, including the actual rearranged DNA nucleotide sequence or sequences identified, sample collection dates, the receptor locus in which each dominant sequence was found, the specimen type analyzed, the estimated sequence abundance (ie, the number of residual clonal cells per million nucleated cells), and the 95% confidence interval for each MRD result.
A blue bar will be placed next to one of the sequences listed on this page to indicate that it is the sequence determining the MRD result for the current sample.
Tracking (MRD) Report: MM, CLL, ALL, and MCL
Tracking (MRD) Report: MM, CLL, ALL, and MCL
Subsequent pages of the report display the sequence-level information in a chart format. This “sequence-level MRD” chart provides a longitudinal view of results for each individual tracked sequence.
Tracking (MRD) Report: MM, CLL, ALL, and MCL
Tracking (MRD) Report: MM, CLL, ALL, and MCL
The appendix provides more details on the immune repertoire of the analyzed sample, including the sample clonality, the number of sequences assessed for each locus, and the number of unique sequences assessed.
Tracking (MRD) Report: DLBCL
Tracking (MRD) Report: DLBCL
In this example, residual disease was detected in a plasma sample. This is indicated by the “plus” sign as well as the language stating “Residual Sequence(s) Detected” in the blue box on page 1 of the report (1). Also in the blue box, the report provides a quantitative assessment of the number of sequences detected per milliliter (mL) of plasma evaluated.
Tracking (MRD) Report: DLBCL
Number of residual sequences observed out of total volume (in mL) of plasma assessed.
Tracking (MRD) Report: DLBCL
Chart showing sample-level MRD results over time.
Tracking (MRD) Report: DLBCL
Tracking (MRD) Report: DLBCL
Subsequent pages of the report show detailed information relating to the current and previous samples including the actual rearranged DNA nucleotide sequence(s) identified, sample collection dates, the receptor locus on which each dominant sequence was found, the specimen type analyzed, and the number of dominant sequences identified in each sample that has been evaluated (4).
A blue bar (5) will be placed next to one of the sequences listed on this page to indicate that it is the sequence determining the MRD result for the current sample. The sequence(s) that determined the previous samples are noted with a blue check mark.
Tracking (MRD) Report: DLBCL
Tracking (MRD) Report: DLBCL
Subsequent pages of the report display the sequence-level information in a chart format (6). This “sequence-level MRD” chart provides a longitudinal view of results for each individual tracked sequence, for the current sample as well as for past ctDNA samples sent for clonoSEQ testing for this patient. Similar to the “sample-level” chart, the sequence-level chart includes a point on the chart for each ctDNA test with a corresponding test date, but on this chart, each individual sequence is displayed separately.
ctDNA, circulating tumor DNA.
Tracking (MRD) Report: DLBCL
Tracking (MRD) Report: DLBCL
The Appendix provides additional details on the immune repertoire of the analyzed sample, including the sample clonality, the number of sequences assessed for each locus, and the number of unique sequences assessed.
View reports at a glance in the Clinical Reports Walkthrough
Get started with clonoSEQ
MCL, mantle cell lymphoma.
This page is intended for a US-based audience.
clonoSEQ® is available as an FDA-cleared in vitro diagnostic (IVD) test service provided by Adaptive Biotechnologies to detect measurable residual disease (MRD) in bone marrow from patients with multiple myeloma or B-cell acute lymphoblastic leukemia (B-ALL) and blood or bone marrow from patients with chronic lymphocytic leukemia (CLL). Additionally, clonoSEQ is available for use in other lymphoid cancers and specimen types as a CLIA-validated laboratory developed test (LDT). To review the FDA-cleared uses of clonoSEQ, visit clonoSEQ.com/technical-summary.